

Your DORA metrics, from Jira.
Every DORA measure, each against your own past. From the releases and bugs already in Jira. Nothing to connect.
Privacy first. No servers. Changes nothing in Jira.

DORA, the delivery metrics
Not the EU’s Digital Operational Resilience Act. DORA here is the research programme at Google behind deployment frequency, change lead time, failed deployment recovery time, change fail rate and deployment rework rate. DORA is a trademark of Google LLC, and Changeline is not made or endorsed by Google.
From a release to a figure
Release a version, log the bug against it, open Changeline. Nothing to set up.
Release a version
Mark a version Released, with its release date.

Log the bug against it
Set the bug’s Affects versions to that release.
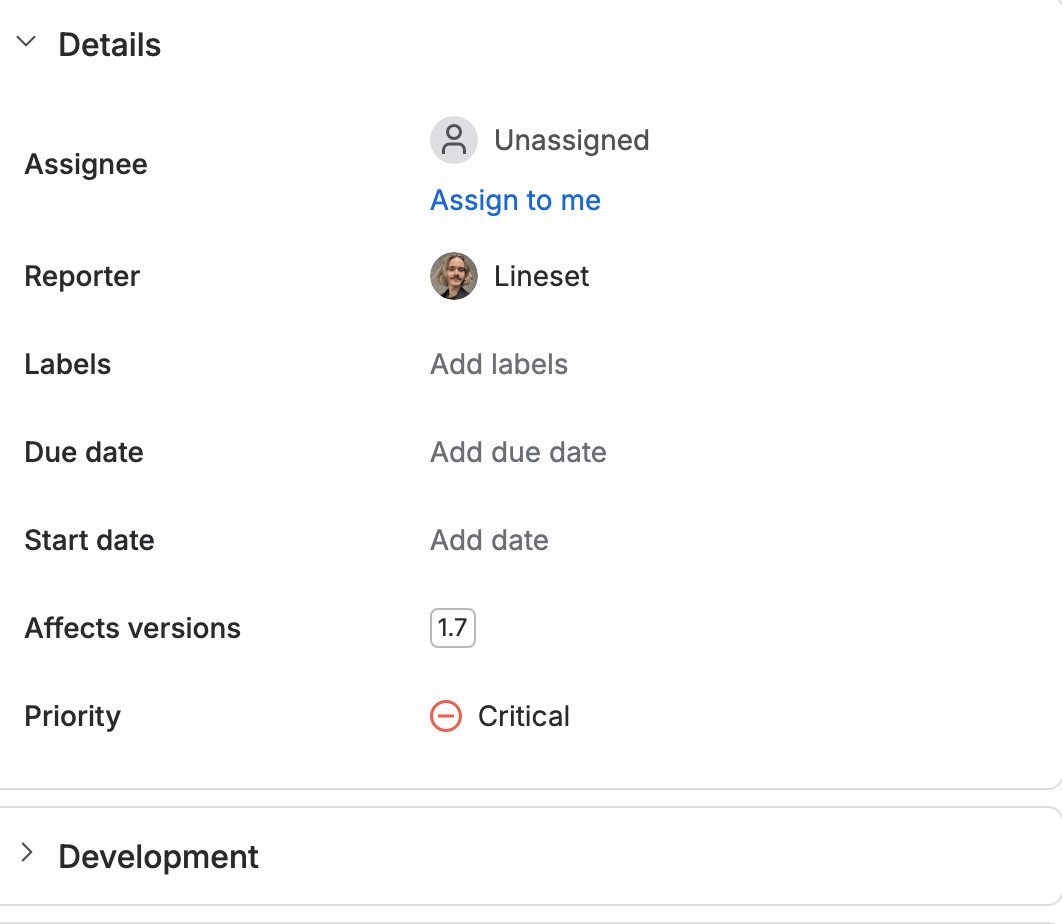
See it on the work item
Its Details column shows its change lead time, the release it shipped in and whether it failed.


Five measures, two groups
Throughput: deployment frequency, change lead time and failed deployment recovery time. Instability: change fail rate and deployment rework rate. Each is judged against your own days just before, never against other teams.

Every figure shows its work
The releases and failures behind a figure, one tab each, and the weeks beside it.


Every space, one view
Pick spaces, a saved filter or a JQL, and a period from 30 to 365 days. A Spaces tab sets each space’s five figures side by side. A space’s own tab counts that space.


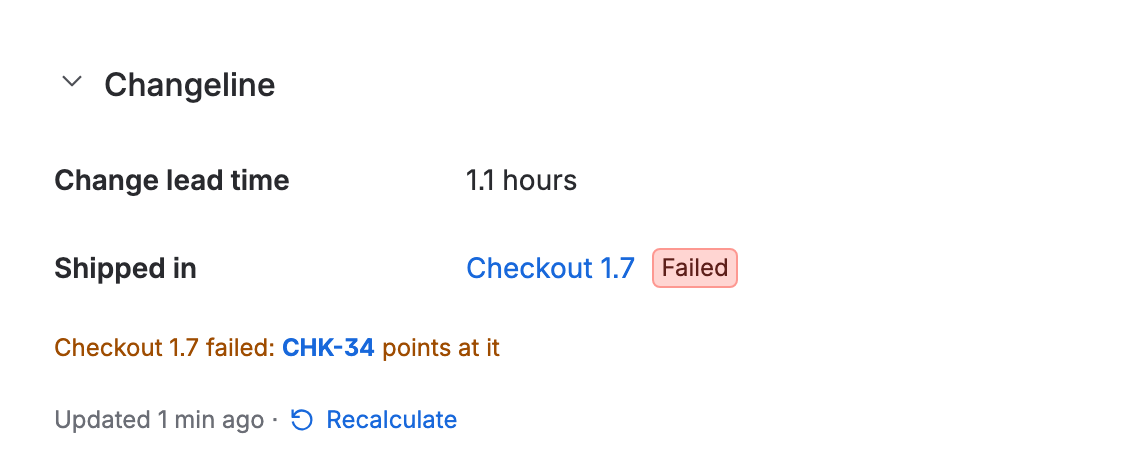
Where one work item’s time went
Waiting to start, in progress, waiting for release, and the release it shipped in, with a lozenge for whether that release failed. A glance of it is in the Details column.


The five, on a dashboard
The five figures and how each moved, for a space, a filter or a JQL, on any Jira dashboard.

How each is counted
Deployment frequency
Released versions with a release date in the period. Or, with no versions, work items that reach Done.
Change lead time
The median from a work item’s first move out of To Do to its release, or to Done.
Failed deployment recovery time
The median from a failure’s creation to the release that ships its fix, else to its Done.
Change fail rate
The share of releases with at least one failure pointing at them, by its Affects versions or a link.
Deployment rework rate
The releases that ship a fix for a failure of an earlier release, out of all releases.
What it never does
Never about one person
Every figure is a team’s. No figure names or is about a person.
No CI/CD data
A deployment is a released version, or a work item that reaches Done. Deployments a CI/CD tool sends to Jira are not read.
An unrecovered failure is named, not counted
It is listed apart until its fix ships or it is Done, and joins failed deployment recovery time then.
Too much is said, not cut off
A read of more than 5,000 work items stops and asks for fewer spaces or a shorter period. If only the days before are too much, the figures stand and a grey line says nothing is compared.
What you get
The figures
- Five measures
- Throughput and instability, as DORA groups them.
- Against your own past
- Each figure carries a better-or-worse lozenge against the same days just before, and its count shows the figure before.
- A trend
- A row a week for 30 and 90 days, a month for 180 and 365, with a chart you set to any of the five.
- Every figure’s work
- Releases and Failures tabs list what was counted.
- Where the lead time goes
- Waiting to start, in progress, waiting for release.
- 30 to 365 days
- The last 30, 90, 180 or 365 days.
Where it shows
- A tab in every space
- That space’s releases and failures, counted on their own.
- Across spaces
- Under Apps, pick spaces, a saved filter or a JQL, and read them side by side.
- On a work item
- Its journey and its release in a panel and the Details column.
- A dashboard gadget
- The five figures for a space, a filter or a JQL.
- Excel, CSV and a link
- Download every tab’s rows, or share the view.
Your rules
- What a deployment is
- A released version, or a work item that reaches Done.
- When work starts
- Its first move out of To Do, or its creation.
- Failure types
- The work types that count as a failure, and the spaces failures are also read from.
- Counts on install
- Released versions, and Bug and Incident types as failures, from the first page.
Dark mode, too
Every Lineset app follows your Jira theme, light or dark.

Secure and private
- Inside Jira
- It runs where your Jira runs, and nothing leaves your site.
- No servers
- None of ours, and no external services: nothing is sent anywhere.
- Changes nothing in Jira
- It reads Jira and writes nothing back.
- Reads as you
- Your own Jira permissions apply, nothing more.
Built on Atlassian Forge. No tracking. What it reads and stores →
Pricing
Free up to 10 users
The price per user drops as you grow
- Billed by Atlassian
- Every feature on the free tier
- 30-day free trial
Questions
Is this the EU’s DORA?
No. This is DORA the delivery metrics: deployment frequency, change lead time, failed deployment recovery time, change fail rate and deployment rework rate. It is not the EU’s Digital Operational Resilience Act. DORA is a research programme at Google and a trademark of Google LLC; Changeline is not made or endorsed by Google.
What does it show right after I install it?
The five figures for the space’s released versions of the last 90 days. Changeline reads the versions and bugs your Jira already holds, so the first page it opens has numbers, with nothing to connect and nothing to set up first.
Do I need a CI/CD tool connected?
No. A deployment is a released version in Jira, or, if you keep no versions, a work item that reaches Done. Deployments a CI/CD tool sends to Jira are not read.
Does Changeline change my work items?
No. It reads Jira as you and writes nothing back, to a work item or to a setting.
What does it cost?
Free up to 10 users, then billed per user by Atlassian, with a 30-day free trial. Every feature is on the free tier. The price per user drops as you grow, and the Marketplace listing shows the exact cost for your site.
All questions →Doing it with Jira’s own tools? Step-by-step guides →


